Pageviews are a great metric for measuring the performance of your site, but they don't always tell the whole story. When measuring our own initatives' success, TownNews looks at several different engagement metrics offered by Google Analytics. Keep reading for a quick look at these important metrics and a step-by-step guide on creating a custom Google Analytics report.
Pages per session
Gaining big jumps in audience numbers can be difficult, especially for established sites. But there are other, easier ways to achieve growth, such as increases in pages per session. This metric measures how many pages a user loads during a single visit to your site. The network average for TownNews customers hovers around 2.20 pages per session, but we believe this number has room for growth.
Users typically visit more pages when they are exposed to more headlines at the point of entry. For example, users who enter on an index page tend to read more content than those that enter on an article page. To combat this and help you improve your pages per session rates,we've recently introduced several new content discovery tools.
Bounce rate
Similar to pages per session, your site's bounce rate tells an important story about user behavior. The bounce rate measures the number of people that came to your site and only read one article. Some bounce rate is always expected, the network average for TownNews is around 65 percent. Viral articles that are sending a lot of one-time users to your site will typically have a much higher bounce rate, often over 80 percent. An average bounce rate higher than 75 percent could indicate that users are experiencing serious issues when navigating a site.
To narrow down why users may be leaving after a single article, try browsing your site as they do.Most users are probably visiting your site from a mobile phone, with a lot of these users coming from social media and search engines, so be sure to mimic these behaviors when testing your site in order to get a better understanding of the user experience.
While testing your site, ask yourself if it is clear there is more content available. The easiest way to spur more browsing is by putting additional content in front of your readers. For example, include in-stream recommendations that direct users to related content or suggest new topics for them to read. It's also important to make sure your mobile navigation highlights the most important sections of your site.
Google Analytics even breaks bounce rates out by article, referrer or device to give you further insights into what may be causing people to leave your site.
Average time spent on page
Not to be confused with average session duration, this metric tells you on average how long users spend on a specific page, such as an article. This metric allows you to see how successful you are at moving users down the page. It also indicates whether or not users are actually reading your articles.
Simple things that can encourage users to keep scrolling on a page are inline assets, subheads, pull quotes and other visual indicators that let them know there is more interesting content coming up. Content with a higher average time on page also tends to have a lower bounce rate, making it more likely that users will visit additional pages.
Google Analytics
Unfortunately Google doesn't put all of this data in one easy report, but they do give you the tools to create your own custom reports. Follow these easy steps to create a customized report with Google Analytics:
1. Click on the customizations nav at the top of the screen
2. Select "new custom report"
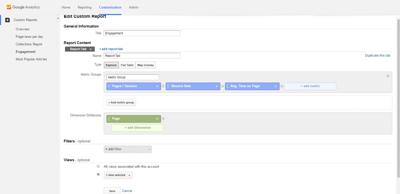
3. Add the following settings:
General Information
Title: Engagement
Report Content
Report Tab: You only need one tab for this report
Name: You can leave this as is or create a custom name
Type: Explorer
Metric Groups: You can leave this as is, but you will want to add these three metrics: Pages/Session, Bounce Rate, Avg. Time on Page
Dimensions Drilldowns: Page
4. Click save at the bottom of the page
With Google Analytics you can create custom reports that include the metrics discussed above.
Creating a custom Google Analytics report with these metrics gives you the "big picture"—making it easier to figure out what's working and what you need to improve upon in order to keep your site's traffic and user engagement growing.